Lumen Grid
Lumen Grid runs a network of batteries and had to explain it, without a single stock photo, in time for its Series A. In six weeks I designed the story, drew the grid’s day as an interactive map in code and built the site.
Client
Lumen Grid, Lisbon
Year
2025
Type
Website
Role
Design and build
Team
Me, Lumen Grid’s head of marketing and one data engineer
Six weeks
Two of design, then four of build, with a demo on a live URL every Friday.
Week 1The story, the site structure and an art direction drawn from one day of the grid’s real data
Week 2The interactive map, designed and prototyped with that data
Weeks 3–5The site in Astro, the map in canvas, and news and careers in a CMS
Week 6Accessibility and speed checks, then launch
Lumen Grid owns batteries that store solar power by day and release it in the evening. That is hard to show. There is nothing to photograph but containers behind a fence.
The Series A date was fixed, and one site had to speak to investors, regulators and the engineers Lumen wanted to hire. There were six weeks and a small team.
Design
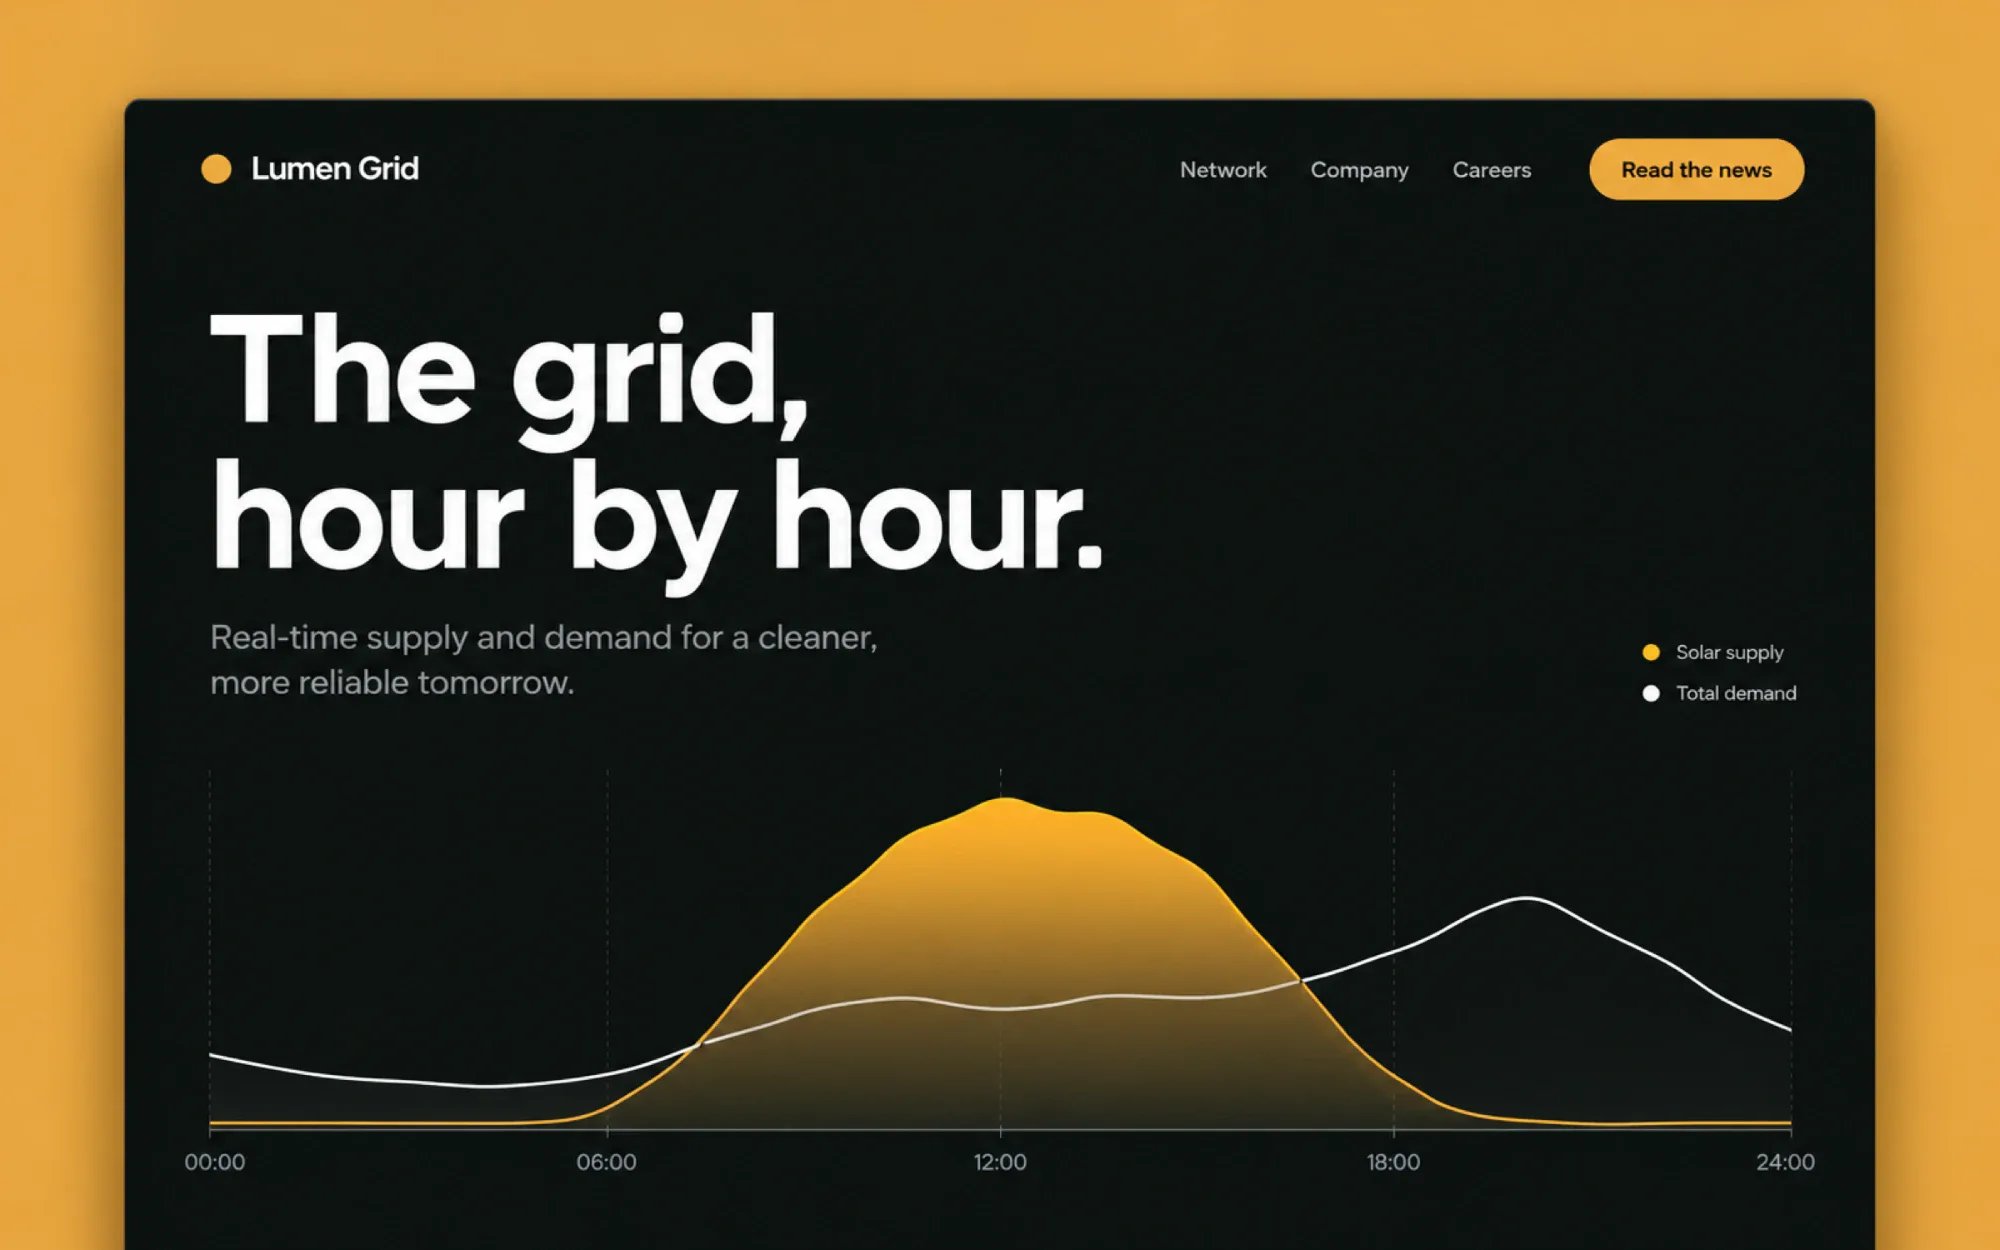
I started from one question: what does the grid do in a day? The answer is a chart, so I made the chart the page. Solar supply rises and falls, demand follows, and the batteries fill the gap, hour by hour.
The art direction is warm and plain: one amber on near-black, one type family and no stock photos. The battery map of Portugal follows the same rule, with one colour for each state of charge.
A story told in the order visitors ask it
Art direction without stock photos
An interactive map of the grid’s day
A battery map of Portugal, node by node

Build
The site is built in Astro and ships almost no JavaScript apart from the map. The map is drawn in canvas from one day of real data in a 60 kB file. News and careers live in a CMS that the marketing team edits, which mattered when 600 people applied for jobs.
Front-end
Astro, with the map in canvas
Content
News and careers in a CMS
Performance
Lighthouse 98 on mobile
Accessibility
A data table behind the map, WCAG 2.2 AA
The result
41,000 visitors
In launch week
600
Job applications in the first month
3 min 10 s
Average time on the home page, most of it spent on the map
“Investors asked about the map before they asked about the numbers. Half the engineers we hired said the site is why they applied.”
Beatriz Nogueira, head of marketing, Lumen Grid

Next project ·
04
Patchwork
Have a product that needs designing and building?